PLACE DYNAMICS
STOREMAGGEDON: THE END OF RETAIL AS WE KNOW IT
WHAT DO SEISMIC SHIFTS IN THE RETAIL LANDSCAPE MEAN FOR YOUR COMMUNITY OR DISTRICT?
An ever-larger number of communities are investing their economic development resources into attraction programs targeting retail and related businesses. Much of the effort is targeted at chains and at trying to recreate a retail environment like that we have known for the last 20 or 30 years. Few people are really aware of the changes taking place in retailing, though, or have given much thought to how they may shape the prospects of any given community or business district. Remarkable changes are occurring in a very short span of time, impacting how consumers shop, where retail businesses locate, and how they operate. These changes will transform our communities. Some will attract new retail businesses. A far greater number will often be trading rather than expanding, attracting one store while losing one or more others in the process. Broken out into specific retail categories, the greatest number of places are likely to see a decline in the number of specialty stores they can support. These trends should lead communities to reflect on their retail strategies, including attraction, support for existing businesses, how to strengthen business districts, and how to cope with surplus commercial space.
Retail is important to any community. Its real value is not in the jobs it offers, which often pay less than in manufacturing or other sectors. The sales and real estate taxes that retailers generate can be essential, but even these are not the reason that a good retail sector is vital to a community. The sector’s importance is in its contribution to the quality of life of a community’s residents. Places that cannot develop a strong retail base will not grow.
Retail and dining meet basic needs and desires of residents, and their presence and quality are a factor in most primary business site selection decisions. Destination shopping, dining, and entertainment districts can even be a magnet to draw in highly-educated and well-paid technical workers, and the businesses that employ them.
When it comes to retail attraction, many economic development organizations – especially outside of downtown and neighborhood revitalization programs – place their emphasis on attracting national chain businesses. These are usually the tenants lured to new retail development projects, they are very visible targets, and they have real estate development staff who can be easily approached.
It is less easy to work with independents and small chains, beginning with the fact that they may be difficult to identify. These businesses may require a great deal more technical assistance, and perhaps even forms of assistance falling outside of the economic development organization’s capabilities. Independents also lack the name recognition of chain stores, and may experience a higher rate of failure. On the other hand, advocates of buying local point out that a far greater share of earnings at local businesses stay within the community, and these unique stores offer a different experience than the homogeneous chains. That uniqueness can draw in customers who would otherwise shop elsewhere.
Putting aside questions about what retail attraction targets are most attractive, it will be more useful for many places to consider what kind of retail attraction targets are most feasible. To do this we need to understand how the retail industry is evolving, the patterns of chain store locations (and both openings and closings), and the overall volume of new store activity.
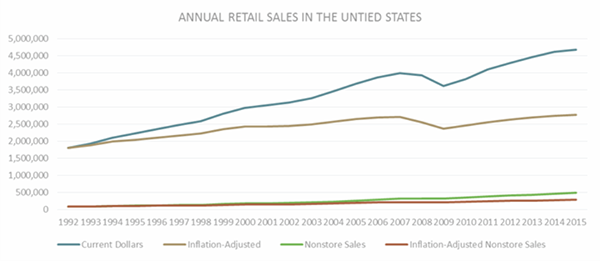
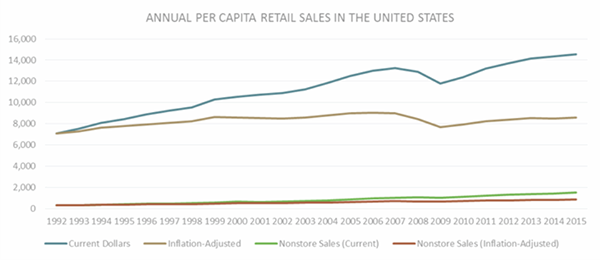
Still, we are not getting the full picture because the population has grown, and some of the sales tallied are the result of a larger consumer base. If we look at sales per capita, we can see a peak in 2007, and that it took five years, until 2012, for sales per capita to top the 2007 level. When the numbers are adjusted for inflation, we finally get to see what is really happening to retail sales. The peak spending year actually occurred in 2006. Nine years later we have still not caught up to that level of spending.
So here is a simple way to boil it down. In constant dollars (1992 dollars adjusted for inflation) the average person spent $9,044 on retail goods in 2006. In 2015 that average had dropped to $8,598. Our spending on retail is $446 less, today, than it was almost a decade ago.
According to research by McKinsey & Company, 40 percent of people say they will not return to their former spending levels, and less than a quarter cite poorer financial conditions as the reason.
We Are Shopping Less Often
Part of the decline in per capita spending is related to economic conditions. Household incomes have been flat or declining for a sustained period, even prior to the recession, and many people no longer have, or are willing to tap home equity, or will not take on debt to expand their retail purchases.
But it also appears that our shopping habits have changed. In addition to spending less, we are shopping less often and visiting fewer stores during our shopping trips. These trends started before the recession, but accelerated over time. The retail analytics firm, ShopperTrak, uses devices at over 40,000 retail stores to measure foot traffic. Shopper visits have fallen about five percent per month, in year-to-year comparisons, for more than two years, continuing a longer trend.
Other data back up this finding. Shoppers today visit an average of 3.4 stores during a trip to the mall. That compares with an average of five stores in 2006. The American Time Use Survey, compiled annually by the Bureau of Labor Statistics, finds that the percentage of the population shopping on any particular day declined to 38.7 percent in 2014, from 41.3 percent in 2004. The amount of time these people spent shopping also declined from an average of 0.98 hours to 0.93 hours.
As an interesting tangent, Euclid Analytics is using customer cell phone tracking to compile data on shopper conversion and length of stay, finding that about 9.0 percent of shoppers who walk past a store will come in, and on average will remain for 27.7 minutes. Only 7.2 percent of customers left in less than five minutes, and 11.7 percent of customers made a return trip within 30 days of their visit. This seems to suggest that shopping has become more deliberate, or purpose-driven.
Our Patterns Have Changed
The values of American shoppers also appear to be shifting – even while remaining steady in other ways. On the one hand we have a return to basics. People are spending more on grocery shopping (though maybe due to rising food costs) while being less inclined to splurge on luxury items. But on the other hand, it seems that spending on electronics and lattes has gone on unabated. Perhaps these have become the new basics?
Shoppers are spending less on apparel. The rise of the casual office has been a big part of that trend, along with rapid growth of older population cohorts, and the financial constraints of the Millennial Generation. Apparel retailers and department stores have been hit especially hard by these trends.
Two core retail categories are returning to vitality. Home spending is up as households undertake long-postponed renovation projects or simply redecorate. Before the recession the home improvement and home furnishings sectors were a great source of growth, but both were hit very hard in the housing crisis. As the housing market recovers these sectors seem ready to grow again.
Most shopping, though, is much more deliberate than before. Customers are sticking to a shopping list and are less willing to make impulse purchases. They are researching products and pricing online before going to the store, or waiting to purchase items they see in the store until they have had a chance to compare prices and reviews online.
Lastly, it appears there may be some good news for small businesses. MasterCard SpendingPulse tracks purchases and reports activity based on sales volume. Businesses with $50 million or less in retail sales – what it defines as small businesses – have seen their sales grow at a faster pace than the retail industry as a whole.
Online Retailing is Taking a Bite from Stores
This point gets enough media coverage that it does not need to be belabored here. One simple statistic helps to explain the impact on physical stores. Since 1992, the year in which detailed data began to be reported, non-store retail sales have grown from 4.4 percent, to 10.4 percent of all retail sales. Non-store sales include catalog sales and vending along with sales from purely internet-based retailers. Internet sales by retailers with physical stores are not included in this number.
The internet sales trend compounds the issue of reduced retail spending. When we take out the portion of sales at retailers without stores, we see that the amount spent in physical retail stores drops to a 2006 peak of $8,374 per capita (1992 dollars adjusted for inflation), and has since fallen to $7,707. This results in a total decline in physical store spending of $667 per person – and that does not factor in the internet sales of businesses with both physical stores and internet sales.
Where is this trend headed? Consider an anecdote. The National Retail Federation reported that 151 million people shopped on Black Friday in 2015. Of that total, 102 million shopped in stores, while 103 million shopped online. Of course, some did both.
The Bureau of Economic Analysis has estimated the total volume of internet sales since the fourth quarter of 1999, when they totaled 0.6 percent of all retail sales. That percentage has risen in every following quarter to 7.4 percent in the third quarter of 2015. Comparatively, total retail sales have increased by a compound annual growth rate of 2.95 percent in each year over the past decade, while internet sales have increased by 15.2 percent annually.

What is Happening to Chains?
The picture is not rosy for retail chains. At the top of the list we know about the consolidation and continued struggles of the department store chains. Sears has lost sales and market share for more than two decades and rarely passes a quarter without closing stores. JCPenney’s, Macy’s, Bon Ton, and others may not appear so destined to fail, but struggle to maintain sales and have also closed many stores. Even once unassailable Walmart has struggled to grow same store sales, and at the start of 2016 announced the closing of 254 U.S. stores.
Many other chains are closing stores or are merging with competitors to remain viable. This, too, results in store closures. The recent merger of Family Dollar and Dollar Tree resulted in the closure of nearly 400 stores. Analysts expect the recently announced acquisition of Rite Aid by Walgreen’s to lead to closure of as many as 3,000 stores. The list of closures among struggling chains includes the likes of Dots (359), Wet Seal (338), Deb Shops (300), Office Depot (265), Staples (225) Anna’s Linens (200), Abercrombie & Fitch (180), Aeropostale (120 in 2014, with another 126 expected in 2015), Pep Boys (63), Pier One (60), and Express (50). This is only a partial list and the past few years have produced countless similar examples.
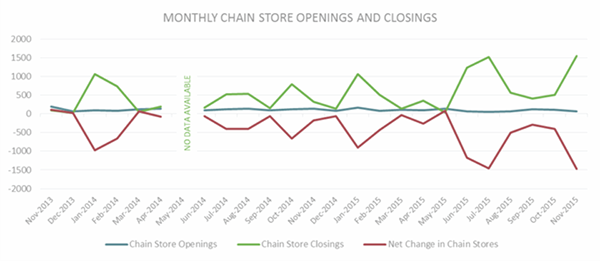
The pace of store openings has slowed considerably. Growth in store counts at the 100 largest retailers by revenue has slowed to less than three percent from more than twelve percent three years ago, according to Moody's Investors Service. This is just new store openings, not net of closures. The retail staffing firm SaRS reports monthly openings and closings aggregated from most store chains. Over the past three years there have consistently been a greater number of closures than new store openings. Aren’t we supposed to be well into a retail recovery?
The data is not all that attractive when looking at the entire industry. The Census Bureau’s Center for Economic Studies publishes annual business dynamics statistics by sector, enabling a comparison of store openings to closures. The two parallel each other, and openings have usually exceeded closures, but the trend is clearly to smaller numbers.
THE CHANGING NUMBER OF RETAIL STORES
Using data from County Business Patterns, it is possible to look at the net change in retail businesses at the county level. County Business Patterns includes only those businesses with employees, which would capture chain retail establishments. While it would be ideal to measure the number of closures and the number of new establishments, this information is not reported at any local level. The net change is a reasonable surrogate for determining where new stores are opening.
There are a total of 3,143 counties (or their equivalent) in the United States. Between 2008 and 2013, there was a net loss of 37,310 retail establishments in these counties. The change was made up of 48,103 establishments lost in 2,401 counties and 576 counties adding a total 10,793 retail establishments. The remaining 166 counties had no net change. Half of all of the increases were recorded in just ten counties. About a two-thirds (371, or 64.4 percent) of those counties adding retail saw a change of one establishment or fewer per year.
The numbers are sobering. More than nine out of every ten counties in the United States saw a change of one or fewer new retail stores per year – and most recorded a loss. Since the statistics used here are for counties, what does that mean for the usual circumstance that there are multiple cities in the county? In all but the most desirable locations, the pace of retail growth is slow – or negative.
Over the same period, retail stores without formal employees (sole proprietorships, family businesses and partnerships) grew in number. These businesses posted an increase of 75,754 stores in 1,250 counties, but with half of the gains realized in just 54 counties. Meanwhile, 1,724 counties lost a total of 44,357 stores.
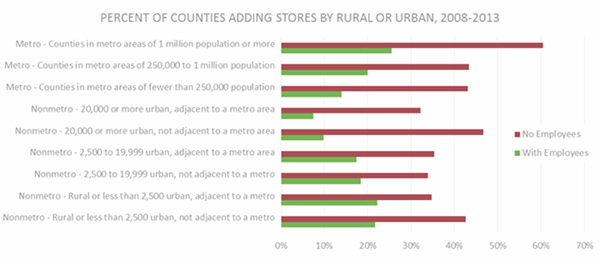
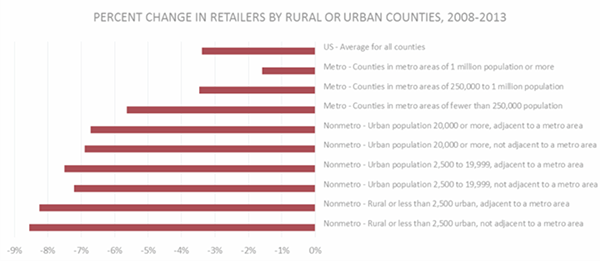
The Census Bureau’s Economic Research Service has created a classification system with nine groupings describing the degree to which counties are rural or urban. Comparing the change in the number of retail establishments with employees across this spectrum reveals a clear pattern.
The average county in the United States lost 3.39 percent of its retail base (number of stores with employees) between 2008 and 2013. As a general rule, counties that fall on the more rural end of the continuum saw a greater percentage loss of stores. The data for non-employers is somewhat similar. Counties in metropolitan areas with a population greater than 250,000 tended to see an increase in businesses, while smaller counties tended to record a decline.
THE MOST DESIRABLE STORES
Communities across the country are very much alike in their desires to attract certain types of retail stores. In launching retail attraction campaigns they are hoping to bring in the high profile national chains, and particularly those that people are leaving the city to find and shop elsewhere. They want to attract the likes of Kohl’s, Costco, Old Navy, and Lone Star Steakhouse. Without a market population of 100,000 and a median income of $50,000, most will at best get the interest of Family Dollar, Walgreen’s, Verizon, and Sonic. There is nothing wrong with these chains, but they do not meet the community’s desires for better general merchandise, apparel, and other specialty retail good. Can that desire realistically be fulfilled?
The higher-order retail many communities hope to attract is referred to as GAFO; meaning general merchandise, apparel, furniture, and other. These are the kinds of goods typically found in a department store. Looking at the location patterns of some of these stores types – general merchandise and apparel – will give a still clearer picture of the emerging retail landscape.
Apparel Retail
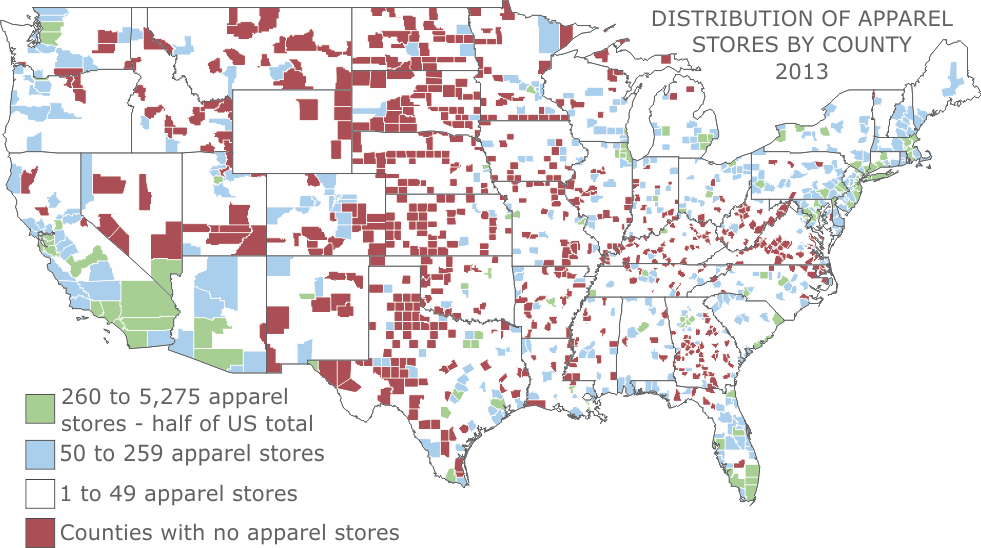
In 2008 half of all apparel retail was concentrated in 100 counties with 327 to 5,723 stores. By 2013 there were 146,344 apparel and accessory stores in the U.S., a decline of 9,233 (or 5.9 percent) in five years. Apparel stores could be found in 2,518 counties, though 114 counties now account for half of the total. These 114 counties had between 260 and 5,275 apparel stores, and together had lost 4,278 stores, or 46.3 percent of the national total. Only 17 of the top counties had an increase in apparel stores.
There is just a single apparel retailer in 354 counties and five or fewer in 960 counties. This is important as shopping for clothing often involves comparison, and places with a concentration of clothing stores will attract more customer traffic. In 2015 Bloomberg Business looked at the tenant mix of 546 of the roughly 1,100 regional malls in the country, and found them to have an average of 58 apparel and accessory stores. Places that have few clothing stores or those losing clothing stores are likely to see an increasing share of market potential lost to competing business districts and the internet.
PERCENTAGE LOSS OF APPAREL STORES 2008- 2013
Counties with 260 or more stores in 2013 5.2%
Counties with 50 to 259 stores in 2013 4.7%
Counties with 6 to 49 stores in 2013 10.7%
Counties with 1 to 5 stores in 2013 13.6%
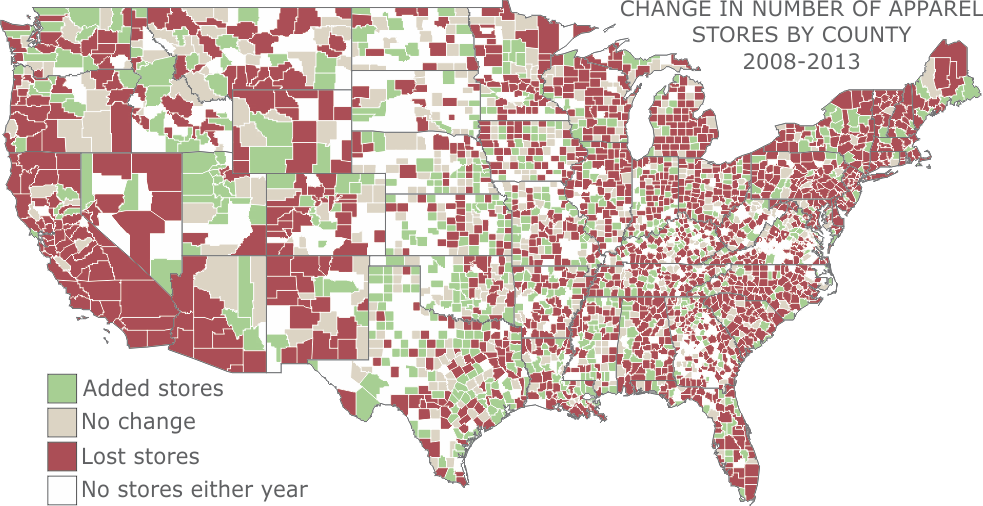
More counties lost apparel retailers than gained, with 1,486 seeing a decline and 666 recording a gain of at least one apparel and accessory store. A small number of counties (65) went from no apparel retailers to one, while almost three times that number (176) went from as many as five to none.
The map and data do allow for some generalizations to be made:
- Many of the declines, and certainly the largest, were in urban areas. This backs up observations about the recent high rate of closures among chain retailers, who have concentrated their stores in these markets.
- Many of the gains seen in rural markets were the result of very small numbers, such as a single apparel retailer locating in a county where none previously existed.
- Apparel retail is becoming even more geographically concentrated due to the more rapid pace of losses in counties with few stores.
General Merchandise
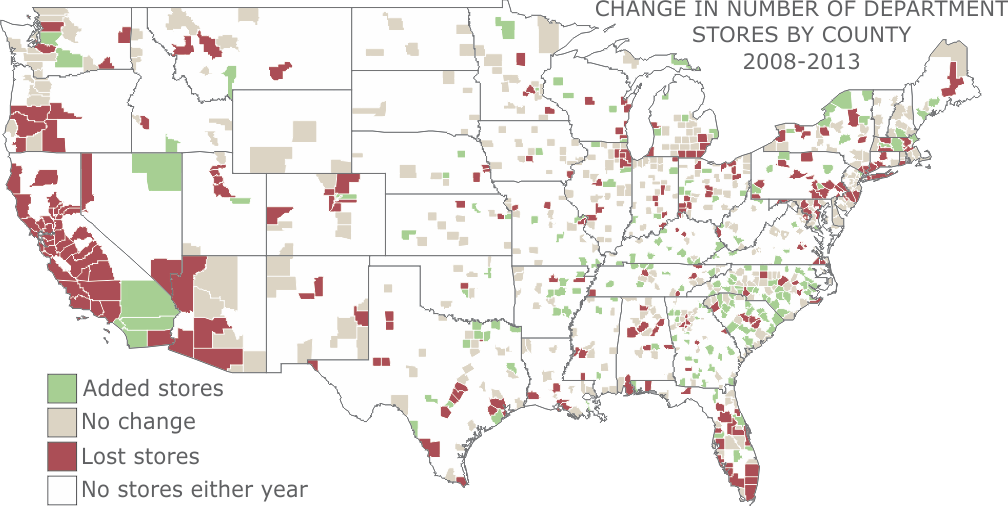
It is more challenging to describe the changes among general merchandise stores, as the industry is very diverse. The main business types include traditional department stores (Macy’s, Penney’s, Kohl’s, etc.), discount department stores (Shopko, Kmart, Walmart, etc.), superstores and warehouse clubs (Walmart, Target, Costco, etc.), and other department stores. This last group is the most challenging to describe as it is a “catch-all” class, but it significantly includes the likes of Family Dollar, Dollar Tree, and other variety stores.
Department stores were long the anchors of downtowns, and later, enclosed regional malls. This industry group has been in a prolonged decline, and even in the five years between 2008 and 2013 lost about 11.7 percent of its total store count, declining from 3,866 to 3,412 stores.
Measured at the county level, 253 counties lost department stores while 187 added stores, but interestingly, there were more counties with department stores in 2013 than in 2008. The changing patterns of commercial development may offer an explanation, if consolidation and store closings in older chains (Sears, Penney’s, Macy’s, etc.) results in the loss of stores in mall locations, while newer chains (Kohl’s, Gordman’s, etc.) tend to open in freestanding buildings. These latter stores are more likely to be in suburban or small city counties where malls did not exist.
Declining numbers will present a challenge to communities, as the struggling chains close stores and leave behind obsolete mall space. The growing chains have usually shunned malls, and continue to open stores in suburban settings, showing little interest in rural or most urban locations.
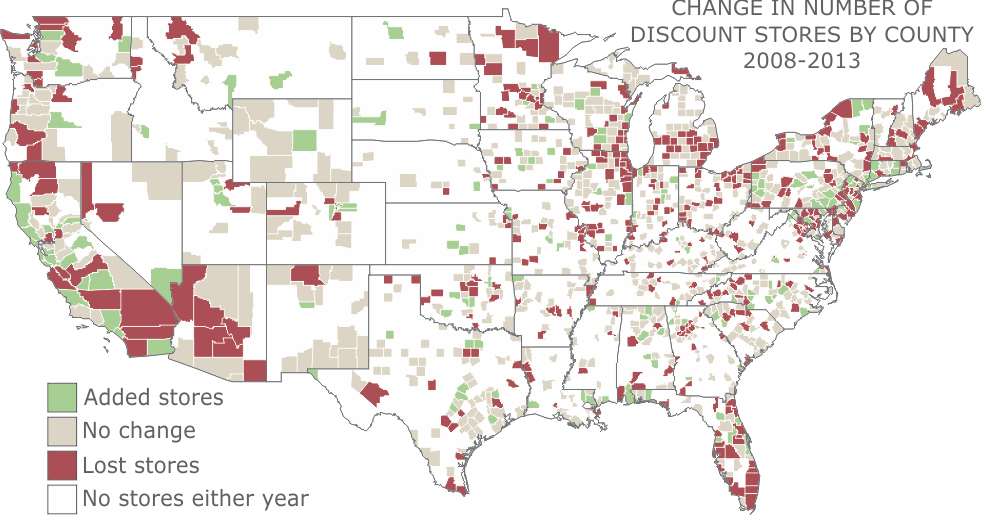
Discount stores are another dying breed. Between 2008 and 2013 their numbers declined from 5,080 to 4,690 stores, a drop of 7.7 percent. Much of the change has been caused by the conversion of discount stores to superstore formats, either at the existing site or a new location. Ongoing store closures by Kmart and others are also a factor in the declining stores counts. The more recent closing of 198 Alco stores in 2014 (about four percent of the industry total) is not included in these numbers.
Most of the closures have been in metropolitan areas. This, again, reflects the locational patterns of more established chains like Kmart, which is closing stores, and Walmart, which is converting stores to the superstore format.
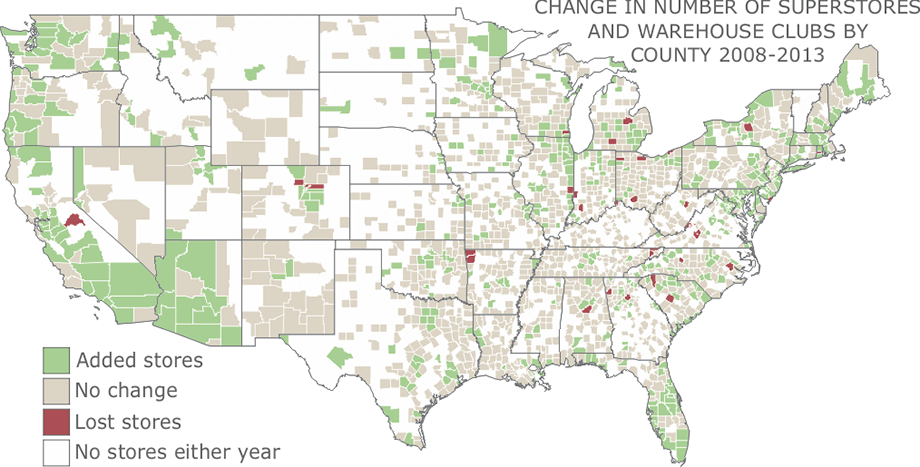
The map of supercenter and warehouse club stores opening and closing is singularly noteworthy for its lack of red. There are only a relative handful counties with fewer superstores in 2013 than there were in 2008. These 35 counties are almost all urban. By comparison, the distribution of counties gaining superstores or warehouse clubs includes all types of counties.
In total, 471 counties added superstores or warehouse club stores. About 56.5 percent of all counties – 1,776 in all – have at least one of these stores. The overall store count increased from 4,411 in 2008 to 5,162 in 2013, an increase of 751. There are some indications that growth is slowing, though, as year-to-year same store sales have flattened at Walmart and other chains, and they are announcing fewer new locations and discount store conversions.
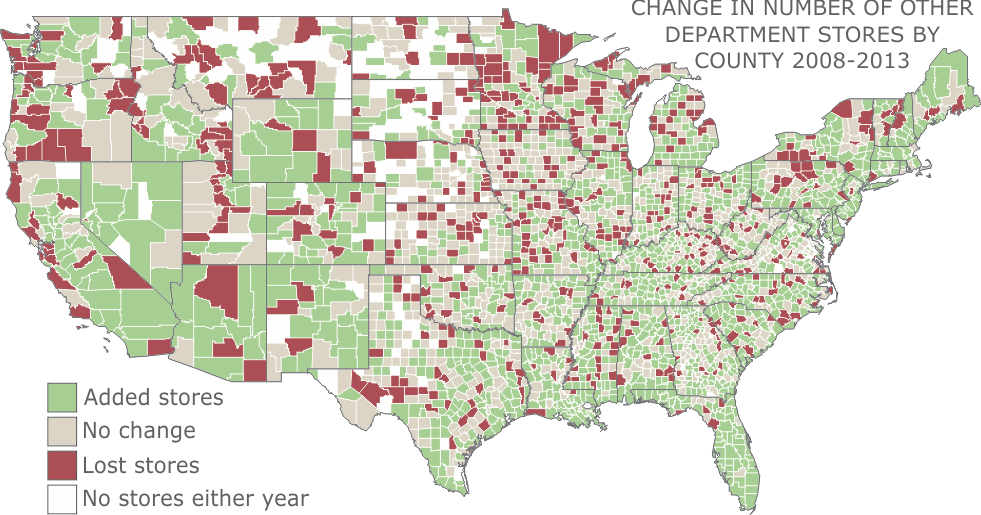
The last group of general merchandise stores to consider is made up of many smaller format retailers, and is titled “other department stores” by the Census Bureau. There were 36,794 of these stores in 2013, more than 2.5 times the number of all other general merchandise stores combined. That number is also 4,335 more than the 32,459 other general merchandise stores that existed in 2008. Dollar store chains like General Dollar, Family Dollar, and Dollar Tree have a significant share of the store count, and until recently have been rapidly adding stores, even through the Great Recession.
These stores have been equally likely to expand in urban, suburban, and rural locations, though a somewhat larger number of closures have been in smaller communities. Some of this may be attributed to recent consolidation in the industry. Chains that combine may close overlapping stores.
Other department stores play an important role, selling a limited assortment of general retail goods and food in rural communities and urban neighborhoods that cannot support grocery stores or larger general merchandise stores.
More counties (918) saw an increase in other department stores between 2008 and 2013, than saw a loss (598). These stores are in 93.2 percent of all counties, a number that is essentially unchanged from 2008.
DRAWING SOME CONCLUSIONS
This white paper has touched on several topics in trying to describe how the retail sector is changing, though more topics could still be added. It may be helpful to offer a summary before turning to a discussion of what they may mean for communities and business districts.
- We are spending less. Even while the raw numbers seem higher, when adjusted for population growth and inflation, spending is considerably below 2006 levels.
- Our preferences and priorities are shifting. This has an impact on what we buy and where we make purchases. Stores are changing their merchandise mix to try to respond to emerging customer desires.
- We are shopping differently. Certainly, the continued growth of online sales has a tremendous impact, but even when we go to the store it is less often and purchases are more deliberate.
- The number of chain stores is declining through consolidation, closures, and market optimization, to capture the greatest possible market share with the fewest number of stores. Rural and urban communities have been negatively impacted by these changes.
- More specifically, the most desirable retail locations have been able to attract or retain specialty retail stores while most secondary (or poorer) locations have lost apparel, furnishings, and other specialty stores.
- While larger stores are in decline, independent “mom and pop” stores opened at a pace more than fast enough to make up for their closures, and to keep the growth in overall store counts positive.
- Department stores continue to close at a significant pace. Closures will continue to present a challenge in the established urban and rural locations where struggling chains like Sears, Penney’s, and Macy’s anchor older malls.
- Superstores, warehouse clubs, and dollar stores have been a bright spot in the retail landscape, expanding through much of the country. Flattening sales and consolidation may be signaling that this, too, will change.
We are faced with a scenario in which a small number of communities within a region, and a small number of districts within communities will be growing while others are in decline. In many places, discussions about retail expansion should really be using the term “trading”. Without substantial growth in the market, new retail development will often only shift spending from one location (and set of stores) to another location and its stores. Those shifts might come at the district, community, or regional level.
If only a relative handful of places are able to attract national retail chains, and particularly the most desirable of them, is your community or district one of those places? Or would you be better served with a strategy that favors working with local businesses to expand sales and start new retail businesses from within the community? What is apparent is that nearly all places have a greater opportunity to build local businesses than they do to lure national chain stores.
What retailers and strategies can realistically be pursued? Despite the somewhat grim picture painted by recent trends, most places can develop a meaningful retail strategy. What is needed, though, is more than just a leakage report and list of chain retailers downloaded from the internet. Communities and business districts need to embrace a more comprehensive approach the builds value for existing businesses, transforms both businesses and districts to adapt to changing consumers and technologies, and positions districts to retain sales while reaching for new markets.
About the Author
Michael Stumpf started his career as a geographer at the Census Bureau before taking his data and analytical skills to the retail site selection community. As an economic developer he continued to hone that practice, helping existing businesses to expand and attracting new retail and restaurants to the communities in which he worked. As a consultant he has served both the private commercial development sector and public clients, providing the market research and strategies for communities, business districts, and real estate development projects across the United States.
%20blue.png?crc=251000060)
3090 S. Country Lane | New Berlin | Wisconsin | 53146 Email
(262) 510-2131 | Wisconsin
(720) 440-2131 | Colorado